
Service Utilization
 When individuals have access to FP services ("supply") and
they are motivated to space or limit births ("demand"),
they are likely to seek out FP services. "Service utilization"
refers to the use of family planning clinics, community-based
distributors, pharmacies, or other sources of family planning
methods. Data on service utilization reflect the results from
the efforts of the FP program.
When individuals have access to FP services ("supply") and
they are motivated to space or limit births ("demand"),
they are likely to seek out FP services. "Service utilization"
refers to the use of family planning clinics, community-based
distributors, pharmacies, or other sources of family planning
methods. Data on service utilization reflect the results from
the efforts of the FP program.
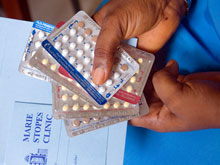
This page provides data on service utilization and sales of contraceptive products from the government and private sector/NGO programs. Explanations for how these indicators are calculated appear in the section of this website on “information.”
DATA ON SERVICE UTILIZATION IN THE PUBLIC SECTOR
1. Contraceptive Prevalence
Proxy Measure based on Service Statistics
This indicator provides a rough estimate of the percent of
married women using contraception in the catchment area. (In this
case, the numbers are estimated from service statistics, not to
be confused with the contraceptive prevalence rate [CPR]
calculated from the DHS or MICS).
| Province | Goal 2010 | New and Continuing
Acceptors 2010 |
2009 | 2010 |
|---|---|---|---|---|
| Bandundu | 1 560 363 | 26 303 | 1,9% | 1,7% |
| Bas-Congo | 669 610 | 23 848 | 1,1% | 4,0% |
| Equateur | 1 895 097 | 15 640 | 0,9% | 0,8% |
| Kasaï-Occ. | 1 536 499 | 287 389 | 6,3% | 19,0% |
| Kasaï-Or. | 1 829 372 | 338 757 | 6,6% | 18,5% |
| Katanga | 2 207 813 | 331 578 | 12,4% | 15,0% |
| Kinshasa | 1 475 122 | 58 966 | 0,8% | 4,0% |
| Maniema | 432 009 | 37 551 | 8,0% | 8,7% |
| Nord-Kivu | 1 307 824 | 105 427 | 1,7% | 8,0% |
| Prov. Or. | 1 999 404 | 32 125 | 0,7% | 2,0% |
| Sud-Kivu | 1 053 969 | 71 106 | 3,1% | 7,0% |
| TOTAL | 15 967 082 | 1 328 690 | 4,0% | 8,0% |
Based on PNSR statistics
Source: PNSR Annual Report 2010 (page 20)
Contraceptive Prevalence by Province in 2009 and 2010
Percentage data is between 0% - 20%
- Bandundu
- Bas-Congo
- Equateur
- Kasaï-Occ.
- Kasaï-Or.
- Katanga
- Kinshasa
- Maniema
- Nord-Kivu
- Sud-Kivu
- Prov. Or.
- TOTAL
Based on Service Statistics
Source: PSNR Annual Report 2010 (page 43)
2009
2010
Commentary - from the PNSR Annual Report 2010
Since 2009, contraceptive prevalence has doubled, from
4% in 2009 to 8% in 2010. Contraceptive prevalence rates
improved in all provinces, with the exception of the province
Bandundu and Equator. The most significant increases occurred
in Kasai-Occidental, Kasai-Oriental, Nord Kivu, Sud Kivu,
Bas-Congo, and Kinshasa, where rates either doubled or
tripled. PNSR considers coordination is necessary to
build on its positive progress for the future, particularly
in the provinces with lower rates of contraceptive prevalence.
2. Couple-Years of Protection
(CAP)
Only two provinces reported on CYP Results:
- Kinshasa: 84 892 CAP
- Bas Congo: 23 848 CAP
DATA ON SERVICE UTILIZATION FROM NGOs
Number of Contraceptives by Organization and Method in 2012 - 2014
ASF
| ASF / PSI | Products | ||||||
|---|---|---|---|---|---|---|---|
| Years | IUD | JADELLE | INJECTABLE | PILLS | CYCLEBEADS | MALE CONDOM | FEMALE CONDOM |
| 2012 (Project AIDSTAR) | 3,038 | 4,026 | 233,606 | 1,149,453 | 13,891 | 34,971,641 | 1,819,694 |
| 2013 (Project AIDSTAR and NORAD) | 3,420 | 11,030 | 282,947 | 1,114,722 | 10,130 | 38,420,804 | 1,471,815 |
| 2014 (Project NORAD and SIFPO) | 3,013 | 34,230 | 138,635 | 851,325 | 1,535 | 2,271,039 | 105,408 |
DKT
| DKT | Products | |||||
|---|---|---|---|---|---|---|
| Years | IUD | JADELLE | INJECTABLE | PILLS | CYCLEBEADS | MALE CONDOM |
| 2012 | 6,247 | 0 | 0 | 126,172 | 0 | 9,390,335 |
| 2013 | 12,757 | 2,818 | 3,732 | 163,776 | 0 | 13,795,180 |
| 2014 | 22,408 | 14,903 | 19,077 | 42,087 | 0 | 19,434,340 |
ABENF-ND
| ABENF-ND | Products | ||||||
|---|---|---|---|---|---|---|---|
| Years | IUD | JADELLE | INJECTABLES 2 Months | INJECTABLES 3 Months | PILLS | CYCLEBEADS | MALE CONDOM |
| 2012 | 0 | 0 | 0 | 0 | 0 | 0 | 0 |
| 2013 | 5,582 | 8,850 | 47,406 | 75,541 | 2,472,376 | 0 | 2,017,372 |
| 2014 | 5,971 | 14,579 | 25,207 | 24,026 | 1,056,730 | 16,193 | 2,409,965 |